PLPlot Getting Started
A Simple Example
PROGRAM main
  USE easifemBase
  IMPLICIT NONE
  INTEGER, PARAMETER :: NSIZE = 101
  REAL( DFP ), DIMENSION(NSIZE) :: x, y
  REAL( DFP ) :: xmin = 0.0, xmax = 1.0, ymin = 0.0, ymax = 100.0
  INTEGER :: ierr
  ! Prepare data to be plotted.
  x = arange(0, NSIZE-1) / REAL(NSIZE-1, DFP)
  y = ymax * x**2
  ! Parse and process command line arguments
  ierr = PLPARSEOPTS( PL_PARSE_FULL )
  IF(ierr .NE. 0) THEN
    CALL Display( "plparseopts error" )
    STOP
  END IF
  !> Initiate the PLPLOT enviroment
  CALL PLINIT
  ! Create a labelled box to hold the plot.
  ! we have specified the box dimension
  CALL PLENV( xmin, xmax, ymin, ymax, 0, 0 )
  CALL PLLAB( "x", "y=100 x#u2#d", "Simple PLplot demo of a 2D line plot" )
  ! Plot the data that was prepared above.
  CALL PLLINE( x, y )
  ! Close PLplot library
  CALL PLEND
END PROGRAM main
PLINIT
This routine should be called before doing anything with PLPLOT. It is the main initialization routine for PLPLOT.
There are several routines affecting the initialization that must be called before plinit, if they are used. The function plsdev allows you to set the device explicitly. The function plsetopt allows you to set any command-line option internally in your code. The function plssub may be called to divide the output device plotting area into several subpages of equal size, each of which can be used separately.
PLEND
Always call plend to close any output plot files and to free up resources.
PLSDEV
The output device can be a terminal, disk file, window system, pipe, or socket. If the output device has not already been specified when plinit is called, the output device will be taken from the value of the PLPLOT_DEV environment variable. If this variable is not set (or is empty), a list of valid output devices is given and the user is prompted for a choice.
The device can be specified BEFORE calling
plinitby:
CALL PLSDEV(STRING::devname)
An ASCII character string containing the device name keyword of the required output device. If
devnameis NULL or if the first character of the string is a ``?'', the normal (prompted) start up is used.
Following is the list of device name.
Plotting Options:
 < 1> xwin       X-Window (Xlib)
 < 2> tk         Tcl/TK Window
 < 3> ps         PostScript File (monochrome)
 < 4> psc        PostScript File (color)
 < 5> xfig       Fig file
 < 6> null       Null device
 < 7> ntk        New tk driver
 < 8> tkwin      New tk driver
 < 9> mem        User-supplied memory device
 <10> wxwidgets  wxWidgets Driver
 <11> psttf      PostScript File (monochrome)
 <12> psttfc     PostScript File (color)
 <13> svg        Scalable Vector Graphics (SVG 1.1)
 <14> pdf        Portable Document Format PDF
 <15> bmpqt      Qt Windows bitmap driver
 <16> jpgqt      Qt jpg driver
 <17> pngqt      Qt png driver
 <18> ppmqt      Qt ppm driver
 <19> tiffqt     Qt tiff driver
 <20> svgqt      Qt SVG driver
 <21> qtwidget   Qt Widget
 <22> epsqt      Qt EPS driver
 <23> pdfqt      Qt PDF driver
 <24> extqt      External Qt driver
 <25> memqt      Memory Qt driver
 <26> xcairo     Cairo X Windows Driver
 <27> pdfcairo   Cairo PDF Driver
 <28> pscairo    Cairo PS Driver
 <29> epscairo   Cairo EPS Driver
 <30> svgcairo   Cairo SVG Driver
 <31> pngcairo   Cairo PNG Driver
 <32> memcairo   Cairo Memory Driver
 <33> extcairo   Cairo External Context Driver
I prefer one of the following
CALL PLSDEV("qtwidget")
CALL PLSDEV("xwin")
CALL PLSDEV("wxwidgets")
PLENV
The function plenv is used to define the scales and axes for simple graphs. plenv starts a new picture on the next subpage (or a new page if necessary), and defines the ranges of the variables required. The routine will also draw a box, axes, and numeric labels if requested.
plenv (xmin, xmax, ymin, ymax, just, axis)
PLBOX
plbox (xopt, xtick, nxsub, yopt, ytick, nysub)
PLLAB
The function pllab may be called after plenv to write labels on the x and y axes, and at the top of the graph.
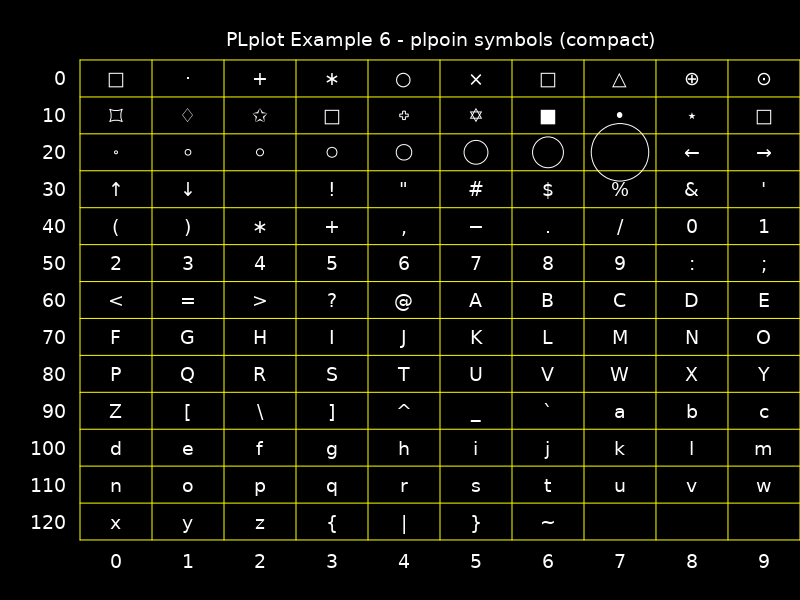
PLPOIN
CALL PLPOIN(REAL::X(:),REAL::Y(:),INT::CODE)
If
0 < code < 32, then Hershey symbols is plotted. If32 <= code <= 127the corresponding printable ASCII character is plotted.
PLSTRING
CALL PLSTRING(REAL::X(:),REAL::Y(:),STRING::STRING)
Plot a glyph at the specified points. The glyph is specified with a PLplot user string. plstring is now the preferred way of drawing points for unicode-aware devices because it gives users full access via a UTF-8 string to any unicode glyph they prefer for the symbol that is is available via system fonts.
See the following example 7
PLSYM
TO BE ADDED LATER.
PLLINE
plline draws a line or curve. The curve consists of n-1 line segments joining the n points in the input arrays. For single line segments, pljoin is used to join two points.
COLORS
- PLCOL0
- PLSCOL0
- PLCOLBG

Following example will print black on white
PROGRAM main
 USE easifemBase
 IMPLICIT NONE
 INTEGER, PARAMETER :: NSIZE = 101
 REAL( DFP ), DIMENSION(NSIZE) :: x, y
 REAL( DFP ) :: xmin = 0.0, xmax = 1.0, ymin = 0.0, ymax = 100.0
 INTEGER :: ierr
 ! Prepare data to be plotted.
 x = arange(0, NSIZE-1) / REAL(NSIZE-1, DFP)
 y = ymax * x**2
 ! Parse and process command line arguments
 ierr = PLPARSEOPTS( PL_PARSE_FULL )
 IF(ierr .NE. 0) THEN
   CALL Display( "plparseopts error" )
   STOP
 END IF
 !> Initiate the PLPLOT enviroment
 CALL PLSDEV("qtwidget")
 CALL PLSCOLBG(255,255,255)
 CALL PLINIT
 CALL PLSCOL0(0, 0,0,0)
 CALL PLCOL0(0)
 ! COLOR
 ! Create a labelled box to hold the plot.
 ! we have specified the box dimension
 CALL PLENV( xmin, xmax, ymin, ymax, 0, 0 )
 CALL PLLAB( "x", "y=100 x#u2#d", "Simple PLplot demo of a 2D line plot" )
 ! Plot the data that was prepared above.
 CALL PLPOIN( x, y, 4 )
 ! Close PLplot library
 CALL PLEND
END PROGRAM main